Market data, published under your brand
Two products a publisher, broker or prop firm can hand to its own audience without building a data pipeline. Your logo, your name. I stay invisible.
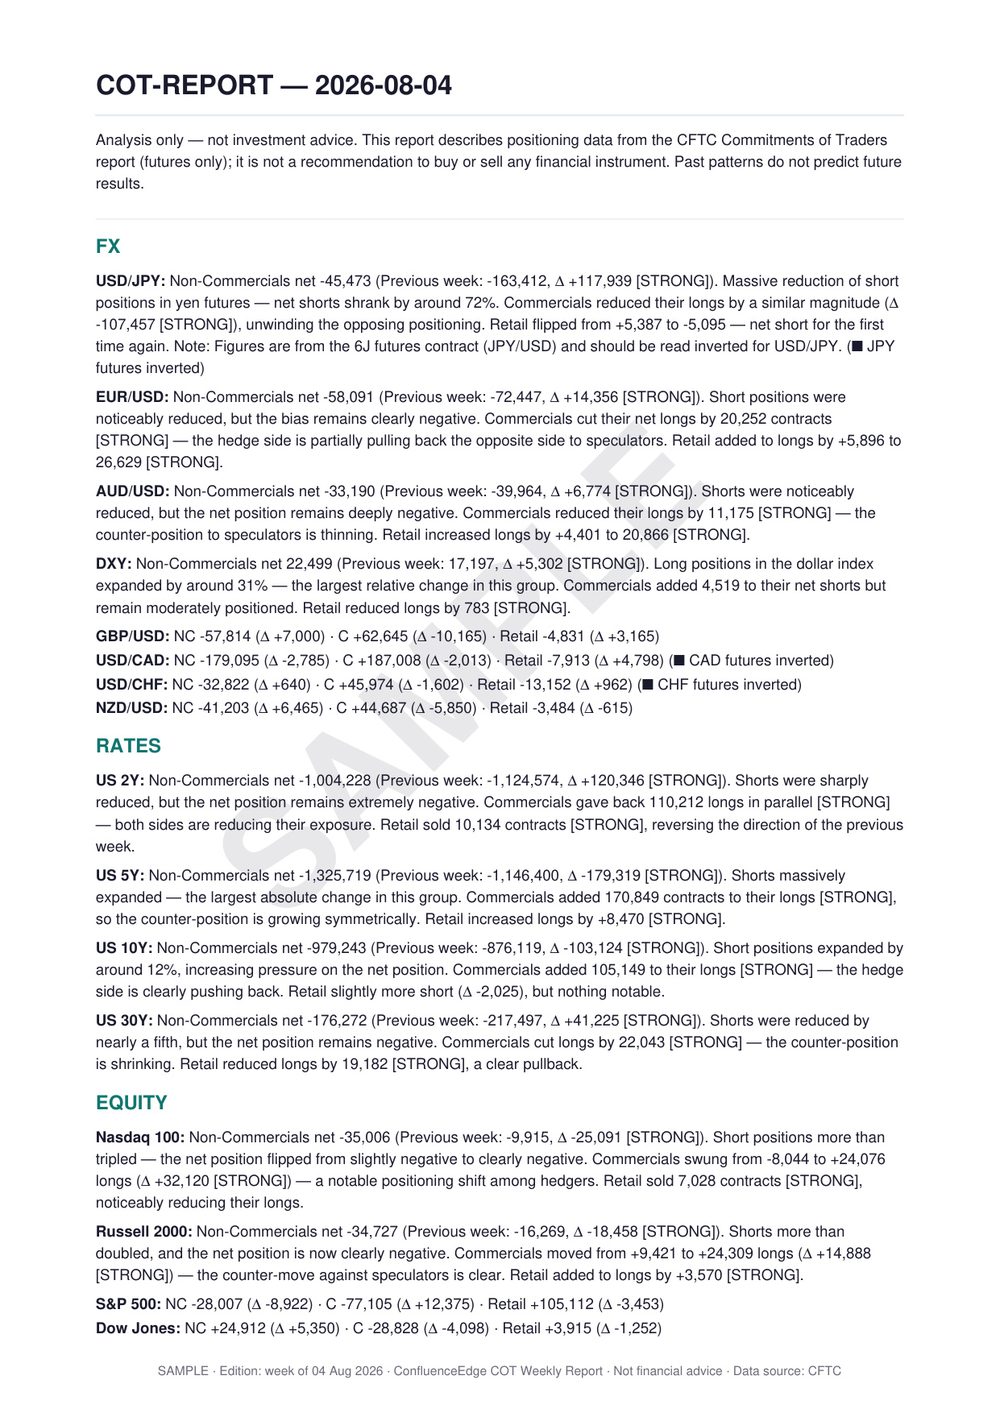
CFTC Commitments of Traders report
Net positioning across FX, rates, indices, metals, energy and crypto, with historical context and written commentary. Delivered every Saturday, after Friday's CFTC release.
- 34 assets across 8 groups
- Non-commercial, commercial and retail positioning with weekly change
- Notable shifts flagged, with the convention caveat for inverted pairs
Macro bias sheet
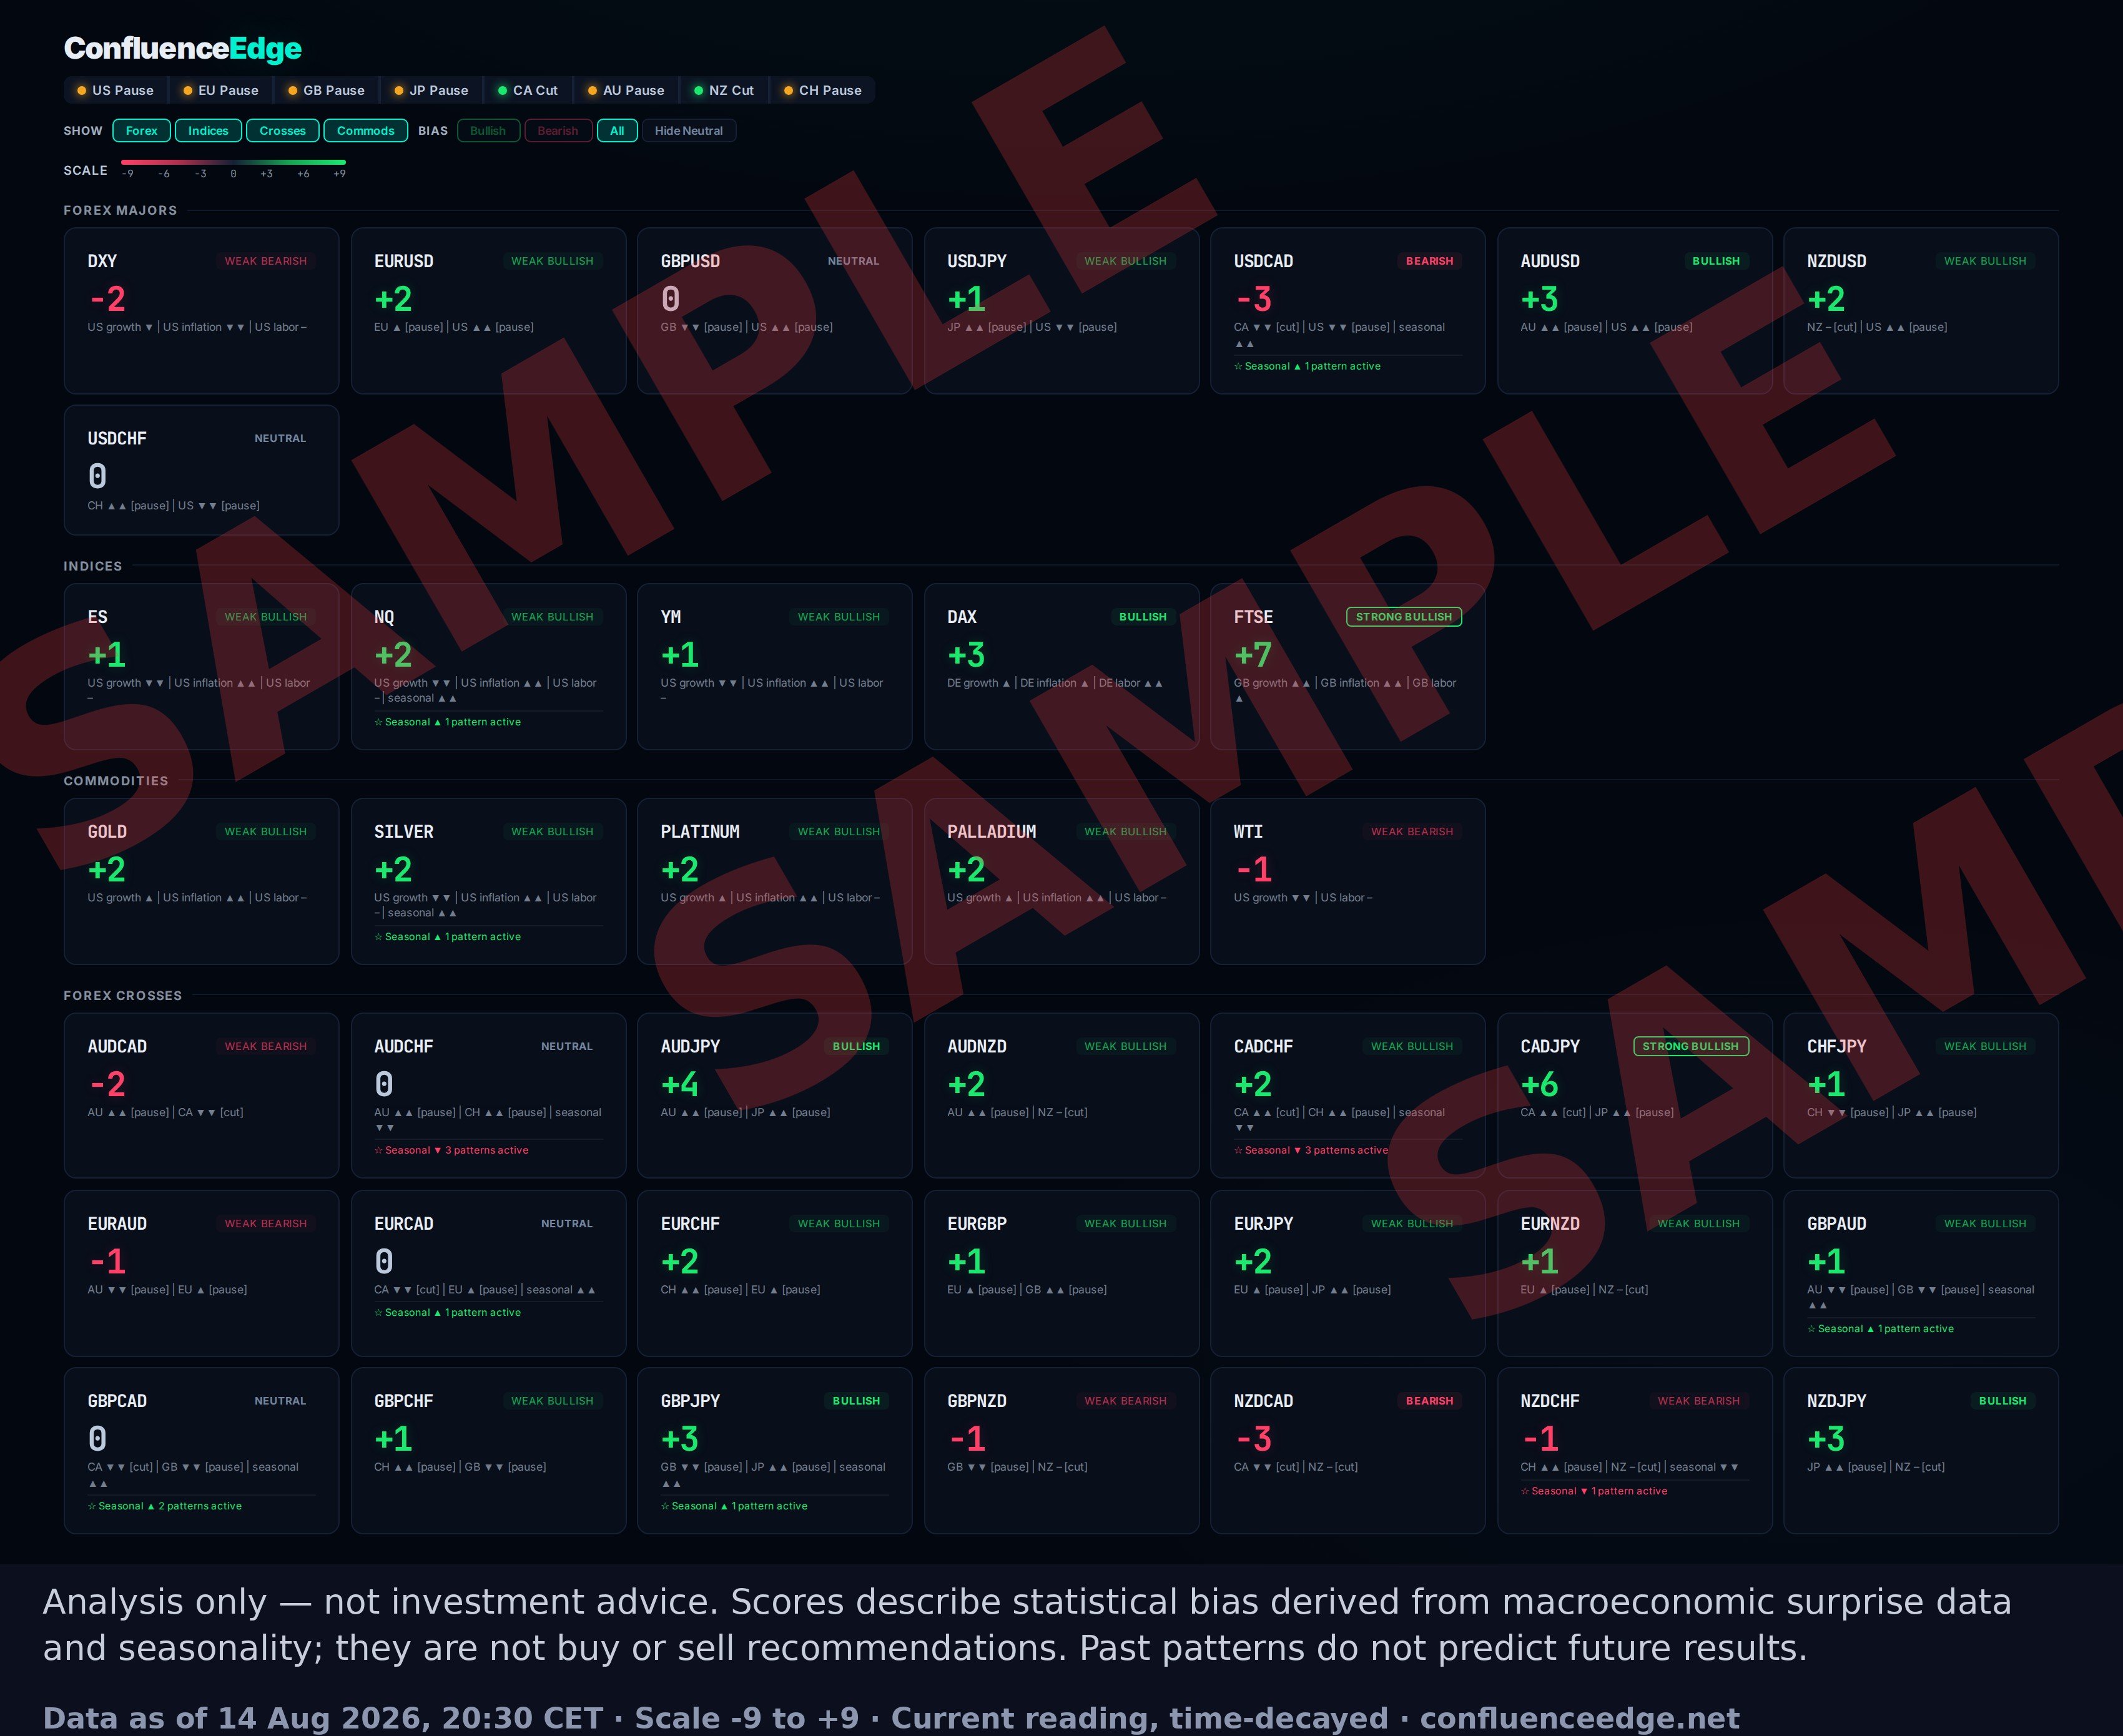
Economic surprise data and seasonality condensed into a single bias score per asset, across 39 assets in four groups. Delivered as a ready-to-publish image.
- Scale −9 to +9, percentile-anchored per asset
- FX majors, indices, commodities and FX crosses
- Central bank stance shown alongside
Licensing
| Product | First month | Ongoing |
|---|---|---|
| COT weekly report | $150 | $300 / month |
| Macro bias sheet | $300 | $600 / month |
| Both | $400 | $800 / month |
| Firm-wide licensing | on request | from $2,000 / month |
The first three rates cover publication on one outlet — your site, your newsletter, your channel. Distributing the sheet across a firm’s client base, or across several brands, is licensed by reach rather than by product, and starts at $2,000 a month. Tell me roughly how many people would see it and I will quote it.
Cancel any time; the first month is a test at the reduced rate, with no commitment. Prices are quoted in the currency of your country on request. What is licensed is the derived analysis — not the underlying economic or CFTC data, which remains publicly available from its original sources.
Talk to me
Reply to the mail you received, or write to info@confluenceedge.net. I will send the next edition with your logo on it so you can show your team what it would actually look like.