Trusted by serious traders

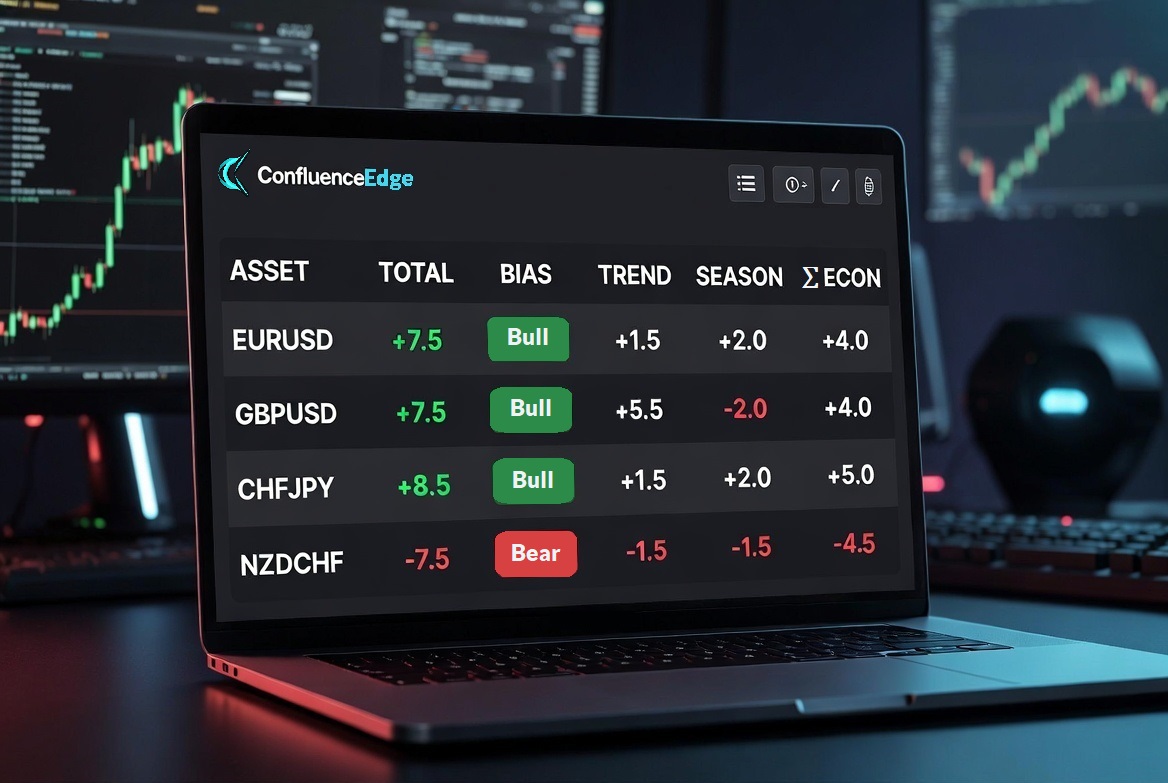
The Macro Dashboard
serious traders rely on.

Live confluence scoring across 39 assets. COT + Macro + Seasonality + Valuation in one stable bias.

ConfluenceEdge Macro Dashboard
Proven across 10+ years of market cycles
Stable Z-Score methodology (no wild swings)
85–88% alignment with established edges – but significantly more stable
LIVE DASHBOARD

See what real confluence looks like.

One view across 39 assets. No guessing. Only clear, data-backed bias.

Main Dashboard Views
Detailed Asset Breakdowns

Four Edges. One Decision.

We combine the strongest, statistically proven market forces into one clear signal.

COT Smart Money

Positioning of Non-Commercials (institutions). The strongest sentiment indicator available.

Macro Surprises

Z-Score deviation from economic data releases with statistically validated edge.

Seasonality

Historically recurring patterns – cleanly calculated and integrated into the total score.

Valuation + Zones

Fair value analysis and Supply/Demand zones – the fundamental context that breaks many pure sentiment setups.

PROOF, NOT PROMISES

Tested like a fund. Not sold like a signal.

Every tool here is run through out-of-sample testing, multiple-testing correction and pre-registration before it ever reaches you – and we retire what fails. Here is what survived.

FDR-VALIDATED EDGE

Supply & Demand zones beat random levels by +6.27pp.

Real zones produced a 62.4% bounce rate vs. 56.1% for random price levels – an out-of-sample edge that survives Benjamini-Hochberg multiple-testing correction. This is the engine behind Zone Finder V4's A/B/C/D tier system.

Straight talk: this statistical edge is the foundation, not an autopilot. A blind mechanical 1:1 strategy on it isn't profitable after costs – the real-world results come from selecting the best zones, sizing your risk-reward, and managing the trade. The tool finds the edge. You apply it.

+6.27pp
OOS edge vs. random
1,839
out-of-sample trades
22yr
44 assets, 2003–2026
p<0.001
FDR-corrected ✓

We test our own assumptions

Classic support/resistance levels showed a negative edge against random in our tests. Supply & Demand zones were the only level-based method with a positive, FDR-validated edge. We follow the data, not the folklore.

Valuation extremes, mapped over 22 years

Our Valuation oscillator times mean-reversion at ±100 extremes. We mapped its hit-rate across 48 assets, both directions, two lookbacks and a separate 5-year window – so you know exactly where it's clean and where it isn't, instead of guessing.

We retire what overfits

The old Forecast Dashboard and seasonality module were killed once walk-forward testing exposed them as overfit. The replacement was pre-registered before we touched the data. Most vendors only show you what worked. We tell you what didn't.

Backtested and historical results are not a promise of future performance. Trading carries risk of loss. These tools provide analysis, not financial advice or trade recommendations.

COMPLETE TOOLKIT

One Edge. Many Powerful Tools.

Every component is battle-tested. Zone Finder, Setup Scanner, and the Macro Dashboard are our flagships.

Zone Finder V3

Multi-timeframe Supply & Demand zones + Gap Scanner with backtested performance and new features.

MTF • Gap Scanner • Backtested • High-probability zones

Setup Scanner Pro

Full Confluence Engine. Scores setups from -10 to +10 with letter grades (A+ to D) and clear reasoning.

Confluence Score • Win-Rate tracking • High-conviction alerts

Macro Dashboard

FLAGSHIP

The web version of our core product. Real-time confluence across 39 assets with live economic surprises and COT.

39 Assets • Live Scoring • Best used together with the Bundle

Forecast Dashboard

Advanced seasonality backtesting with win-rate, robustness scores, and IS/OOS validation.

Seasonality • Win-Rate • Robustness Scoring

Supporting Tools (included in higher tiers)

Smart Money COT Index
Institutional positioning with z-score normalization
Valuation Pro
Fair value analysis across assets
Gap Scanner
High-probability gap setups
TRANSPARENT & FAIR

Choose the plan that fits your edge.

Analyzer

Entry into the tools

$29 /mo
  • Zone Finder V3 (MTF)
  • Smart Money COT Index
  • Valuation Pro + Forecast Pro
  • Gap Scanner
Subscribe on Whop
FLAGSHIP

Macro Dashboard

Web Version

$39 /mo
  • Web Dashboard (39 Assets)
  • Economic Surprise Scoring (14 Indikatoren)
  • COT Smart Money (z-Score)
  • Trend + Seasonality + Total Score
Get Web Dashboard on Whop

The heart of the confluence system

Complete

All Pine Tools

$49 /mo
  • All 5 Analyzer Tools
  • Setup Scanner Pro (Confluence Engine)
  • Forecast Dashboard + Backtests
  • Macro Dashboard (Pine Script)
Subscribe on Whop
Subscribe directly on Whop. Direct Stripe checkout coming soon.

Ready for clear signals instead of noise?

Start with the Macro Dashboard or get the full stack today.

Get started on Whop